DETEQT
Diagnostic targeted sequencing adjudication
This tool been designed to be robust enough to handle a range of assay designs. Therefore, no major assumptions of input reads are made except that they represent amplicons from a multiplexed targeted amplification reaction and that the reference is comprised of only target regions in the assay. The idea is to survey the reads and delineate whether each reference sequence, or target, is present or absent. This means that we're only dealing with reads that will map to the reference and ignoring reads that do not under the assumption that if the target is amplified it will be clearly present. False positives are the primary issue with these assays due to sample bleed (low diversity, barcode, or flow cell oversaturation induced) and low-abundance run-to-run contamination.
The concept is to provide an estimate of overall quality of reads mapping to the reference by reducing 4 mapping metrics into a single calculated value, compare that to the depth of mapping, and apply thresholds to separate positive, negative, and indeterminate results. The metrics used are (per sample, per reference) mean base quality, mean mapping quality, linear coverage, and identity. Linear coverage and identity are represented by the range 0 to 1, so to scale the mean qualities we divide the mean base quality by 37 as an expected value for Illumina systems and divide the mean mapping quality by 60 as expected for BWA. This brings all measured to the range 0-1, except for base quality, which is automatically reduced to 1 should the value be higher. Thus, the formula is:
Quality Calculation = linear coverage * identity * (uBaseQ / 37) * (uMapQ / 60)
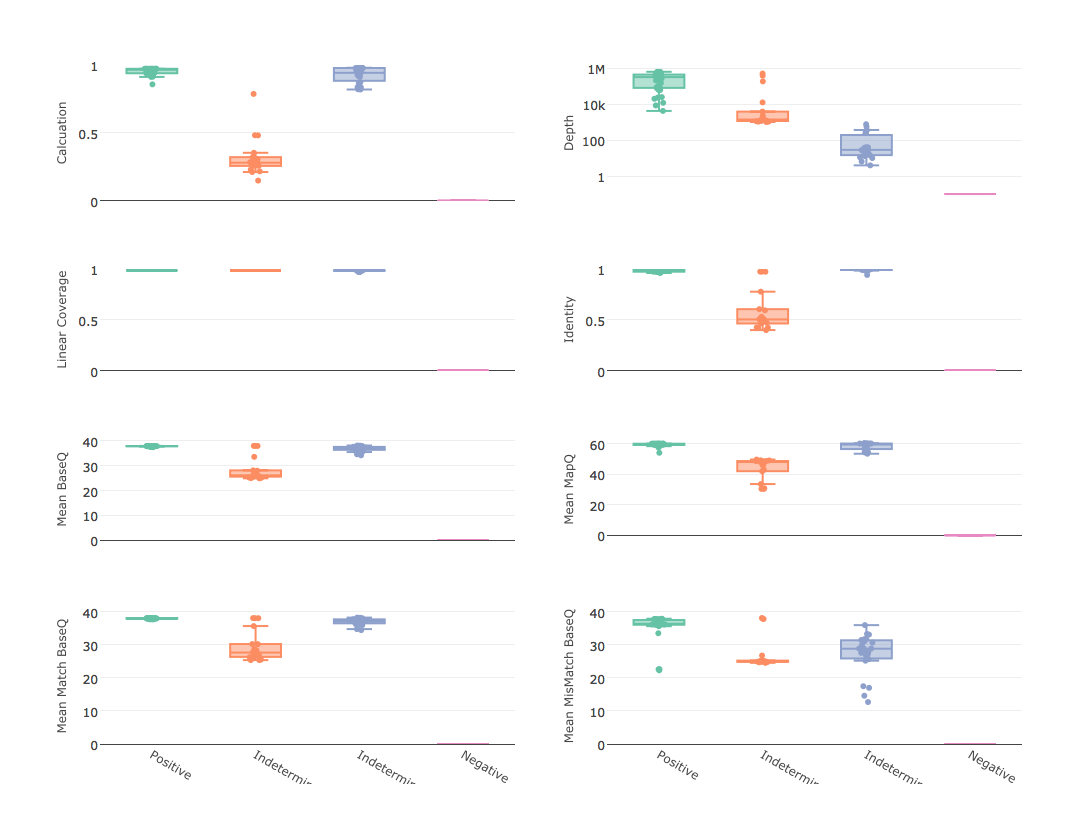
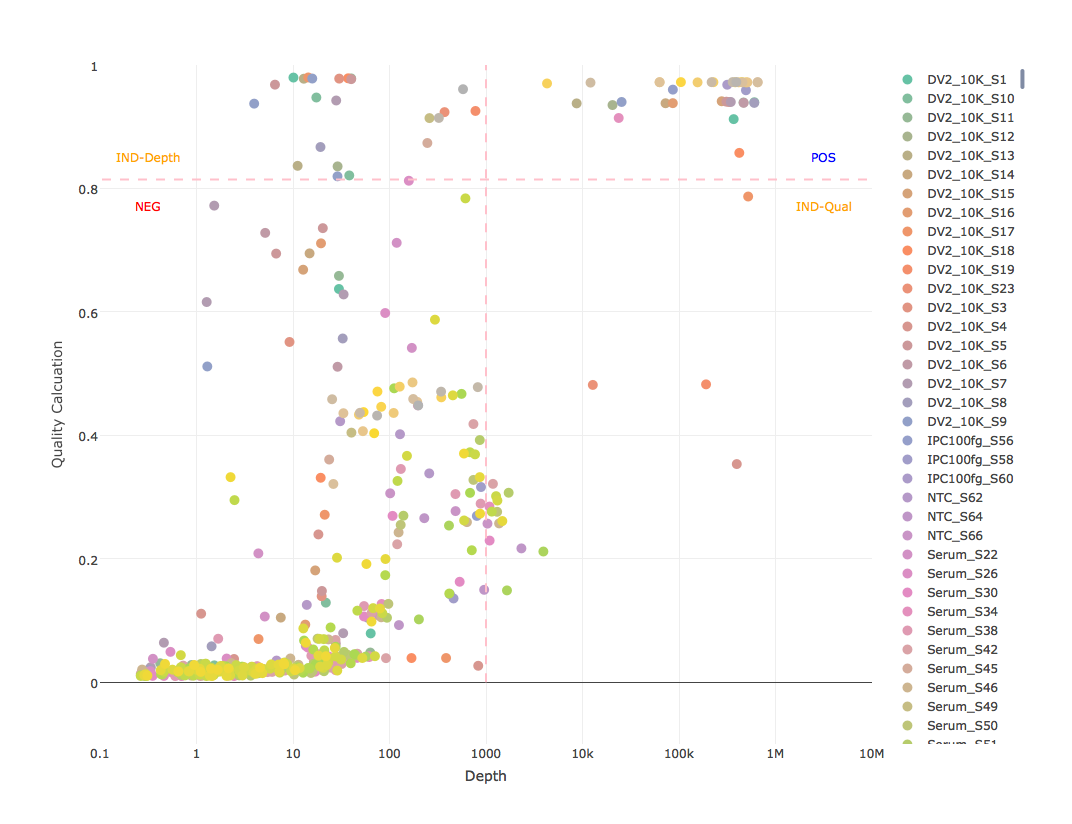
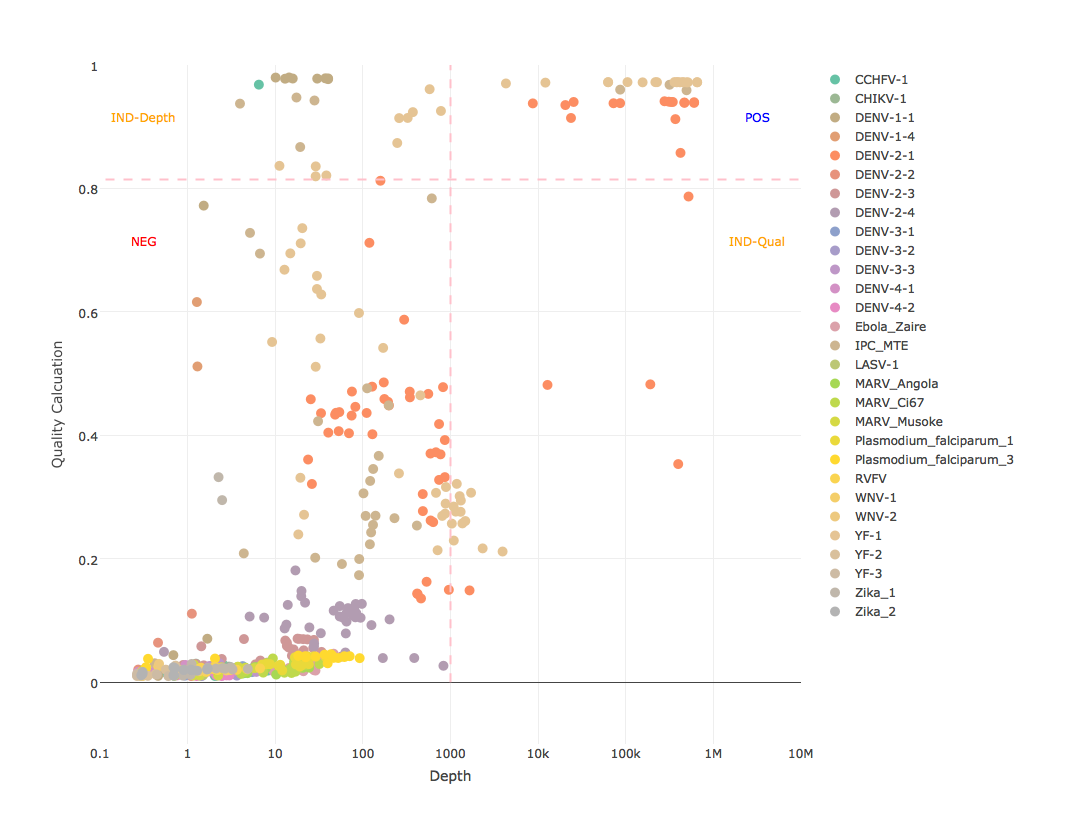
This calculation is designed to be simple enough to quickly compute in a script and stringent enough to handle most indicators of a false positive, to include reduced base quality from sample bleed, reduced mapping quality from mismapped reads, reduced identity from divergent strain, and any combination that could indicate anything other than a true positive (see attached mapping stats graphs). However, this calculation alone does not constitute as an analytical model because it does not consider abundance. Like with GOTTCHA, reling on read depth as an indicator of abundance, not number or percent of reads. Considering a depth of at least 1E3 and a quality calculation of at least 0.95^4 (0.8145) as a positive (see example results graph). These thresholds are not set in stone. We're looking into some less subjective ways to set them, but for now they seem to be very robust for all of our assays, especially when low diversity amplicon sequencing is expected.
Installing DETEQT
Download the latest version of DETEQT from Github or use git clone from command line.
git clone https://github.com/LANL-Bioinformatics/DETEQT.git
cd into the DETEQT directory
cd DETEQT
./INSTALL.sh
The sudo privileges are not needed for installation. The installation script will pull required dependencies with internet. A log of all installation can be found in install.log
Dependencies
DETEQT run requires following dependencies which should be in your path. All of the dependencies will be installed by INSTALL.sh.
Programming/Scripting languages
- Perl >=v5.16.3
- The pipeline has only been tested in v5.16.3
- R >=v3.3.1
Unix
- sed
- awk
- cut
- curl/wget
Third party softwares/packages
- bwa (v0.7.15-r1140) - reads aligner
- samtools (v1.3.1) - process bwa output
- phantomjs (2.1.1) - convert html to png
R packages
- webshot (0.3.2) - convert html to png
- plotly (4.5.6) - interactive plots, the following R packages will be installed when plotly installed.
- stringr (1.1.0)
- colorspace (1.3-1)
- gtable (0.2.0)
- plyr (1.8.4)
- reshape2 (1.4.2)
- RColorBrewer (1.1-2)
- dichromat (2.0-0)
- munsell (0.4.3)
- labeling (0.3)
- Rcpp (0.12.8)
- mime (0.5)
- curl (2.3)
- openssl (0.9.5)
- R6 (2.2.0)
- htmltools (0.3.5)
- yaml (2.1.14)
- stringi (1.1.2)
- assertthat (0.1)
- DBI (0.5-1)
- BH (1.62.0-1)
- ggplot2 (2.2.0)
- scales (0.4.1)
- httr (1.2.1)
- jsonlite (1.1)
- magrittr (1.5)
- digest (0.6.10)
- viridisLite (0.1.3)
- base64enc (0.1-3)
- htmlwidgets (0.8)
- tidyr (0.6.0)
- dplyr (0.5.0)
- tibble (1.2)
- hexbin (1.27.1)
- lazyeval (0.2.0)
- purrr (0.2.2)
(Optional)
- shiny (1.0.0): interactive plots server, shared some plotly depended packages and extra requirement list below
- DT (0.2)
Perl modules
Python package
Running DETEQT
Usage:
    DETEQT -ref ref.fa --indir input_dir --samples sample_description_file
Inputs:(requried)
    --ref            Reference FASTA file
    --indir          Directory with input Fastq files
    --samples        Sample descriptions tab-delimited files. (header:#SampleID Files)
General:
    --help           This help
    --version        Print version and exit
    --quite          No screen output (default OFF)
Outputs:
    --outdir         Output directory
    --prefix         Filename output prefix [auto] (default '')
    --force          Force overwriting existing output folder (default OFF)
Alignment:
    --align_options  BWA mem options in quotation (ex: "-x ont2d" for Oxford Nanopore 2D-reads)
Computation:
    --cpus           Number of CPUs to use [0=all] (default '4')
    --mode           Paired-End (PE) or Single-End (SE) (default PE)
    --q_cutoff       Quality Calculation cutoff (default 0.8145)
    --depth_cutoff   Depth of coverage cutoff (default 1000)

    Expected value     Expected value for respective quality metric
    --expectedCoverage  (1)
    --expectedIdentity  (1)
    --expectedBaseQ     (37)
    --expectedMapQ      (60)

    Weigth options     Weight for respective metric (sum=1) [double]
    --coverageWeight    (0.25)
    --identityWeight    (0.25)
    --baseqWeight       (0.25)
    --mapqWeight        (0.25)
sample_description_file: is a tab-delimited file with header #SampleID Files. In the Files column, the paired-end fastq files are separated by a comma and all the fastq files should be located in the input directory (--indir) ex:
#SampleID      Files
Dengue         sample.1.fq,sample.2.fq
Flu            flu.1.fq,flu.2.fq
Ebola          ebola.1.fq,ebola.2.fq
MERS           mers.1.fq,mers.2.fq
SARS           sars.1.fq,sars.2.fq
Zika           zika.1.fq,zika.2.fq
Rota           rota.1.fq,rota.2.fq
HIV            hiv.1.fq,hiv.2.fq
Hanta          hanta.1.fq,hanta.2.fq
HCV            hcv.1.fq,hcv.2.fq
Test
We will provide small test data set to check if the installation was successful or not.
Outputs (--outdir)
|-/mapping
|-/reports
   |--prefix_quality_report.html
   |--prefix_quality_report.png
   |--prefix_sample_plot.html
   |--prefix_sample_plot.png
   |--prefix_target_plot.html
   |--prefix_target_plot.png
|-/stats
   |--prefix.mapping_stats.txt
   |--prefix.report.txt
   |--prefix.run_stats.txt
|-prefix.log
mapping: a directory contains all samples mapping to reference bam file, bam index, and log files
reports: a directory contains report html, png files and log file.
stats: a directory contains the mapping statstics tab-delimited table. (see below table description)
prefix.log: report of all the commands/scripts/errors that were ran as part of the pipeline.
Quality report
Sample plot
Target plot
mapping_stats tab-delimited table:
| Column | Description |
|---|---|
| SampleID | Sample Name |
| Target | Target Reference ID |
| Length | Target Reference sequence Length |
| Quality_Calculation | Coverage * Identity * (BaseQ_mean / 37) * (MapQ_mean / 60) |
| Depth_Mean | Target Reference average coverage depth |
| Depth_RMS | Target Reference coverage depth |
| Depth_StdDev | Target Reference coverage depth |
| Depth_SNR | Depth_Mean / Depth_StdDev |
| Coverage | Target Reference linear coverage |
| Match_Bases | Matched bases count |
| Mismatch_Bases | Mismatched bases count |
| Total_Bases | Match_Bases + Mismatch_Bases |
| Identity | Match_Bases / (Match_Bases + Mismatch_Bases) |
| BaseQ_mean | Mapped reads all bases average quality |
| BaseQ_RMS | Mapped reads all bases quality root mean square |
| BaseQ_StdDev | Mapped reads all bases quality standard deviation |
| BaseQ_SNR | BaseQ_mean / BaseQ_StdDev |
| Match_BaseQ_mean | Matched bases average quality |
| Match_BaseQ_RMS | Matched bases quality root mean square |
| Match_BaseQ_StdDev | Matched bases quality standard deviation |
| Match_BaseQ_SNR | Match_BaseQ_mean / Match_BaseQ_StdDev |
| Mismatch_BaseQ_mean | Mismatched bases average quality |
| Mismatch_BaseQ_RMS | Mismatched bases quality root mean square |
| Mismatch_BaseQ_StdDev | Mismatched bases quality standard deviation |
| Mismatch_BaseQ_SNR | Mismatch_BaseQ_mean / Mismatch_BaseQ_StdDev |
| MapQ_mean | Mapping quality average |
| MapQ_StdDev | Mapping quality standard deviation |
| MapQ_RMS | Mapping quality root mean square |
| MapQ_SNR | MapQ_StdDev / MapQ_StdDev |
| Mapped_Reads | Target Reference mapped reads count |
| Fraction_Reads | Target Reference mapped reads count / Total mapped reads |
| Determination | Based on Quality_Calculation and Depth_Mean (see make determination calls below) |
report.txt tab-delimited table:
| Column | Description |
|---|---|
| SampleID | Sample Name |
| Target | Target Reference ID |
| Determination | Based on Quality_Calculation and Depth_Mean (see make determination calls below) |
| Depth_Mean | Target Reference average coverage depth |
| Quality_Calculation | Coverage * Identity * (BaseQ_mean / 37) * (MapQ_mean / 60) |
run_stats tab-delimited table:
| Column | Description |
|---|---|
| SampleID | Sample Name |
| Prefilter_Reads | Raw reads number |
| Unmapped_Reads | Unmapped reads number |
| Percent_Unmapped_Reads | Unmapped_Reads / Prefilter_Reads |
| Mapped_Singlets | One of the paired reads mapped number |
| Percent_Mapped_Singlets | Mapped_Singlets / Prefilter_Reads |
| Postfilter_Reads | Proper paired reads number |
| Discarded_Reads | Prefilter_Reads - Postfilter_Reads |
| Discarded_Percent | Discarded_Reads / Prefilter_Reads |
| Percent_Run | Prefilter_Reads / sum(Prefilter_Reads) |
DETEQT R Shiny app
The app is for interactively visualizing mapping_stats output file.
Usage:
Rscript ShinyApp/app.R outdir/stats/prefix.mapping_stats.txt Quality_Calculation_cutoff  Depth_of_coverage_cutoff port

         Default Value:
         Quality_Calculation_cutoff: 0.95^4
         Depth_of_coverage_cutoff: 1000
         port: 3838  (R Shiny Server port)


ex:
    Rscript ShinyApp/app.R ShinyApp/DETEQT_02222017.mapping_stats.txt
live demo: The DETEQT output visualization R Shiny app on shinyapps.io.
To host by the Apache, the folowling set up need to be configured in the apache config file
	ProxyPass /shiny/websocket  ws://localhost:3838/websocket
	ProxyPassReverse /shiny/websocket  ws://localhost:3838/websocket
	ProxyPass /shiny/ http://localhost:3838/
	ProxyPassReverse /shiny/ http://localhost:3838/
Removing DETEQT
For removal, delete (rm -rf) DETEQT folder, which will remove any packages that were downloaded in that folder.
PseudoCode
Shell pipe
- map with BWA, default settings
- samtools sort
- samtools calmd -e (replace matches with "=", requires FASTA reference)
Switch to scripting language
- filter out not paired in sequence, not paired in mapping, failed vendor quality check, etc. reads (FaQCs basic filtering, but no length or quality cutoffs)
- split reads by reference (in MATLAB, this is just by the BAM index, not the actual reads, which are then accessed as a subset)
- cat all reads end-to-end
- cat all base qualities end-to-end to match cat'd reads
- calculate the following (plus root mean squared, standard deviation, and signal-to-noise when mean is calculated):
- mean of the base qualities (optional: split by matches and mismatches using the cat'd reads != or == "=" as an index)
- mean mapping quality from all reads
- linear coverage (using built-in MATLAB function getBaseCoverage and calculate % with depth of 0)
- identity by # of "=" in cat'd read string by the length of the string
- percent of reads of sample
- mean depth (using same data from linear coverage)
- calculate overall quality (baseQ/37 * mapQ/60 * linear coverage * identity)
- make determination calls:
- depth >= 1e3 AND calculation >= 0.8145 = POSITIVE
- depth < 1e3 AND calculation >= 0.8145 = INDETERMINATE-DEPTH (indeterminate for depth)
- depth >= 1e3 AND calculation < 0.8145 = INDETERMINATE-QUALITY (indeterminate for quality)
- depth < 1e3 AND calculation < 0.8145 = NEGATIVE
- write entire results to a CSV file
- write condensed results of only positives and indeterminates to a CSV file
- graph each sample for all references with log10 depth as x-axis, quality calculation as y-axis, thresholds as lines, and write to PNG
- graph quality controls box plots of mapping statistics grouped by positive, ind-depth, ind-qual, and negative calls and write to PNG
Contact Info
- Turner Conrad: turner.a.conrad.mil@mail.mil - algorithm design and Matlab code
- Chien-Chi Lo: chienchi@lanl.gov - pipeline implementation
Citations
If you use DETEQT please cite following papers:
-
DETEQT: Conrad TA et al (2019). Diagnostic targETEd seQuencing adjudicaTion (DETEQT): Algorithms for Adjudicating Targeted Infectious Disease Next-Generation Sequencing Panels. J Mol Diagn. 2019 Jan;21(1):99-110. [PMID: 30268944]